Efficient resource management is essential for organizations leveraging Snowflake’s powerful data platform. With this Streamlit app, you can monitor Snowflake costs and resources in real time, providing actionable insights to optimize performance and reduce unnecessary expenses. Imagine managing a large-scale Snowflake environment with multiple users, warehouses, and roles. Without a streamlined approach, tracking usage patterns, understanding resource consumption, and identifying cost-heavy activities becomes a daunting task.
This Streamlit app addresses the challenge by enabling Snowflake administrators to:
- Monitor warehouse usage trends to optimize compute resources.
- Analyze service-level credits usage to track specific Snowflake features such as materialized views or auto-clustering.
- Identify the most expensive users consuming compute credits.
- Understand cost distribution by roles for effective budget allocation.
- Detect queries spilling to local or remote storage, highlighting areas for query optimization.
Key Features of the Application
The application is divided into six interactive tabs, each addressing a specific performance or cost-related aspect:
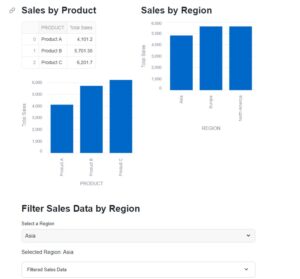
- Warehouse Usage Analysis:
Displays the top 10 warehouses with the highest credit consumption over the last month. The interactive bar chart allows you to visualize warehouse usage trends and allocate resources accordingly. - Service Type Usage Analysis:
Breaks down credits consumed by various Snowflake features (e.g., warehouse metering, pipes, materialized views) over the last month. This helps pinpoint where Snowflake credits are being utilized. - Most Costly Users:
Identifies users with the highest resource consumption over the past month, enabling administrators to review and optimize user workloads. - Credits Used by User:
Shows a proportional breakdown of approximate credits used by users in a pie chart, giving an overview of user-level resource usage. - Warehouse Cost by Role:
Explores cost distribution across roles in the last week, helping allocate budgets or identify roles that require optimization. - Spilled Queries Analysis:
Highlights queries that spilled to disk over the last 45 days, a crucial metric for improving query performance and reducing storage costs.
Technical Details: Building the Application
- Data Queries:
The app uses Snowflake’s account usage schema to query resource consumption metrics. These queries are crafted to retrieve insights on warehouses, users, roles, and storage. - Email Functionality:
Each tab includes a “Send Report” button, enabling administrators to email the analysis directly from the app. This feature ensures that reports are easily shareable with relevant stakeholders. - Diverse Visualizations:
- Bar charts: Visualize trends in warehouse usage and spilled queries.
- Pie charts: Show proportional usage by users or roles.
- Interactive data tables: Display detailed query results with filtering capabilities.
Code Walkthrough:
Tab1: WH Analysis:


Tab2:Service Type Analysis:

Tab3:Most Costly users.


Tab4: Credit used by users.


Tab5:WH Cost per role.


Tab6: Spilled to Disk.


Click on respective send button in every tab we can send an email to the respective stakeholders. Say we want to send email report for WH cost per role. Clicking on the button will send summary to the mail box.

Conclusion
This Streamlit application demonstrates the power of combining Snowflake’s account usage data with an interactive user interface. It not only simplifies performance monitoring but also empowers organizations to optimize costs effectively.