In this post, we’ll explore the dashboard crafted in the Streamlit application. Snowflake is simplifying processes for its valued customers and understands the importance of making data management easy and customer-oriented. With the introduction of Snowsight, it empowers users with a seamless and intuitive data analytics experience. Also accelerates insights and decision-making through interactive visualizations called Dashboards. These dashboards enable the creation of diverse visualizations directly within the Snowflake platform. Additionally “Streamlit makes it easy to explore data in Snowflake, creating an interactive experience for users to discover the Snowflake’s data features.
Embarking on my journey with Streamlit, this is my initial attempt at crafting code within the Streamlit framework. While the code may appear basic to some, it’s the beginning of my learning journey.
In our scenario, the Snowsight dashboard will be transformed into a Streamlit dashboard, harnessing the latest features of Streamlit integrated into the Snowflake ecosystem (SiS).
Below is the dashboard we have developed in Snowsight:
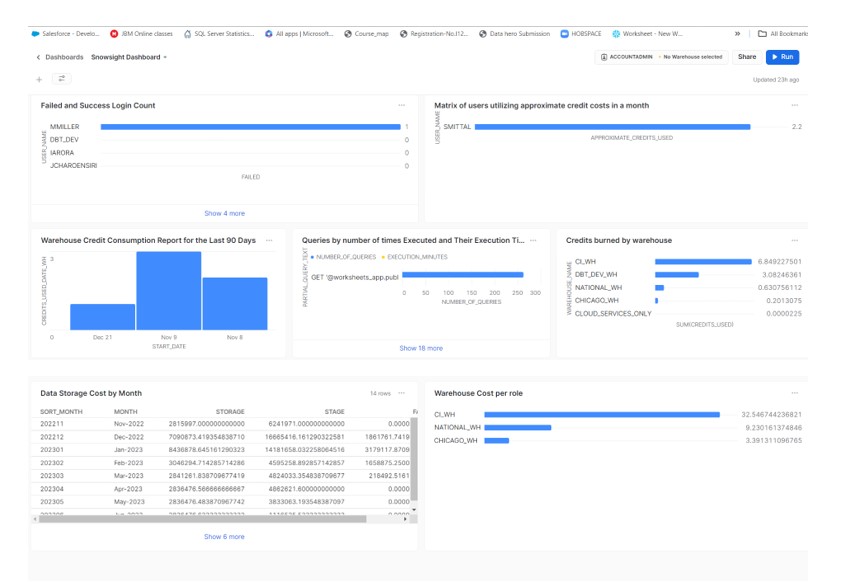
Snowsight Dashboard
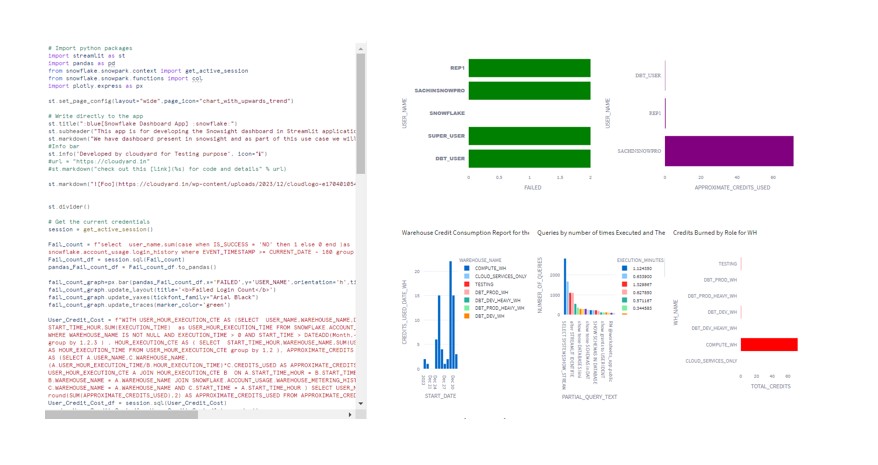
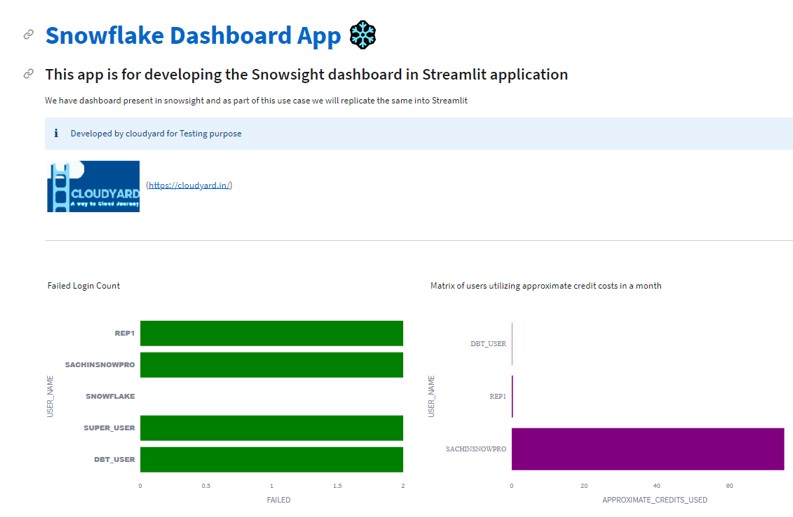
We tried to replicate the same in Streamlits application and below is the outcome of my code:ggg
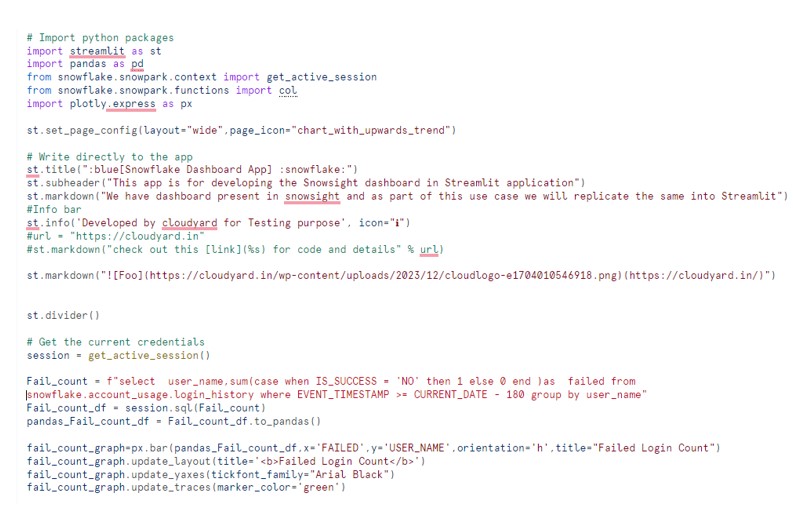
Technical implementation:
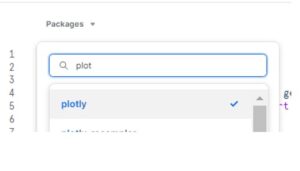
First import the Plotly package. There is no additional setup require to install. Just scroll down the packages and search for required one.
Below is the code to implement the dashboard:
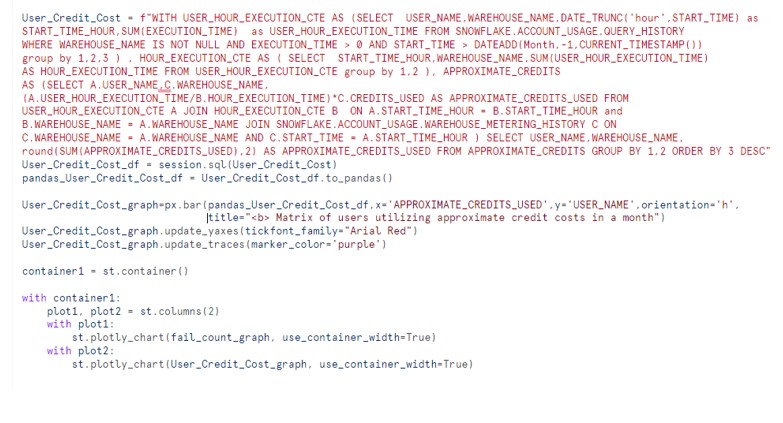
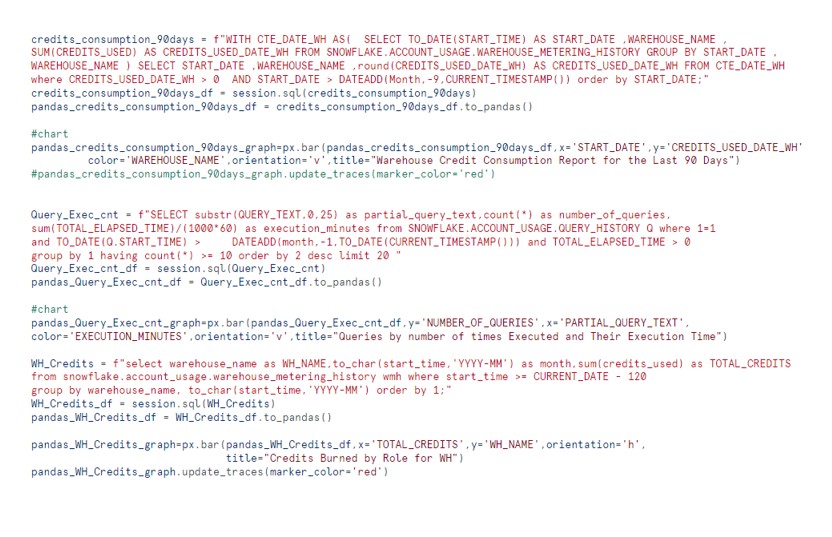
Final outcome shows as below: